Grafana+InfluxDB+Telegraf - Build a VPS System Monitoring Platform
Learn how to leverage Grafana, InfluxDB, and Telegraf to create a robust VPS system monitoring platform. Monitor server metrics, set up Grafana dashboards, and ensure the health and performance of your virtual servers.


Monitoring the health and performance of your VPS is crucial for ensuring its stability and addressing potential issues promptly. In this tutorial, we'll guide you through the process of setting up a comprehensive VPS system monitoring platform using Grafana, InfluxDB, and Telegraf.
 grafanainfluxdatainfluxdata
1. Set up Grafana & InfluxDB
-
Allow port
TCP/8086on your Grafana server -
Create project folder and docker-compose.yml
mkdir -p /your/path/grafana && cd /your/path/grafana && nano docker-compose.yml
docker-compose.yml
version: '3.8'

services:
  grafana:
    image: grafana/grafana-oss:latest
    container_name: grafana
    environment:
      - GF_AUTH_ANONYMOUS_ENABLED=false
      - GF_SERVER_ROOT_URL=https://grafana.example.com/
      - GF_INSTALL_PLUGINS=grafana-clock-panel
    user: '0'
    ports:
      - 127.0.0.1:12345:3000
    volumes:
      - ./grafana-data:/var/lib/grafana
    restart: unless-stopped

  influxdb:
    image: influxdb:1.8
    container_name: influxdb
    environment:
        - INFLUXDB_HTTP_AUTH_ENABLED=true
        - INFLUXDB_DB=telegraf
        - INFLUXDB_ADMIN_USER=admin
        - INFLUXDB_ADMIN_PASSWORD=your_password
        - INFLUXDB_USER=telegraf
        - INFLUXDB_USER_PASSWORD=your_password
    ports:
        - 8086:8086
    volumes:
        - ./influxdb-data:/var/lib/influxdb
    restart: unless-stopped
Note:
GF_AUTH_ANONYMOUS_ENABLED is convenient for exposing your dashboard to others.
INFLUXDB_ADMIN_PASSWORD sets the account password for HTTP authentication.
INFLUXDB_USER_PASSWORD sets the password of the database user.
- After confirming that it is correct, you can bring up the containers
docker-compose up -d
2. Nginx Configuration
- Get SSL certificates
certbot certonly --nginx
- Create Nginx conf
nano /etc/nginx/conf.d/grafana.conf
server {
        listen 80;
        server_name grafana.example.com;
        if ($host = grafana.example.com) {
                return 301 https://$host$request_uri;
        }
        return 404;
}

server {
  listen 443 ssl http2;

  ssl_certificate       /your/key/path/fullchain.pem;
  ssl_certificate_key   /your/key/path/privkey.pem;
  ssl_session_timeout 1d;
  ssl_session_cache shared:MozSSL:10m;
  ssl_session_tickets off;

  ssl_protocols         TLSv1.2 TLSv1.3;
  ssl_ciphers           ECDHE-ECDSA-AES128-GCM-SHA256:ECDHE-RSA-AES128-GCM-SHA256:ECDHE-ECDSA-AES256-GCM-SHA384:ECDHE-RSA-AES256-GCM-SHA384:ECDHE-ECDSA-CHACHA20-POLY1305:ECDHE-RSA-CHACHA20-POLY1305:DHE-RSA-AES128-GCM-SHA256:DHE-RSA-AES256-GCM-SHA384;

  ssl_prefer_server_ciphers off;

  server_name           grafana.example.com;
    add_header Content-Security-Policy upgrade-insecure-requests;
  location / {
    proxy_redirect off;
    proxy_pass http://127.0.0.1:12345;
    proxy_http_version 1.1;
    proxy_set_header Upgrade $http_upgrade;
    proxy_set_header Connection "upgrade";
    proxy_set_header Host $host;
    proxy_set_header X-Real-IP $remote_addr;
    proxy_set_header X-Forwarded-For $proxy_add_x_forwarded_for;
    proxy_next_upstream off;
  }
}
- Restart Nginx
nginx -t
systemctl restart nginx
3. Setup Telegraf
- Next, install Telegraf on each VPS that needs to be monitored. Telegraf is used to monitor the host system. Docker installation is not recommended, so here we install it on each machine by adding sources.
- For deb-based platforms (e.g. Ubuntu and Debian) run the following to add the repo key and setup a new
sources.listentry:
# influxdata-archive_compat.key GPG fingerprint:
#     9D53 9D90 D332 8DC7 D6C8 D3B9 D8FF 8E1F 7DF8 B07E
wget -q https://repos.influxdata.com/influxdata-archive_compat.key
echo '393e8779c89ac8d958f81f942f9ad7fb82a25e133faddaf92e15b16e6ac9ce4c influxdata-archive_compat.key' | sha256sum -c && cat influxdata-archive_compat.key | gpg --dearmor | sudo tee /etc/apt/trusted.gpg.d/influxdata-archive_compat.gpg > /dev/null
echo 'deb [signed-by=/etc/apt/trusted.gpg.d/influxdata-archive_compat.gpg] https://repos.influxdata.com/debian stable main' | sudo tee /etc/apt/sources.list.d/influxdata.list
sudo apt-get update && sudo apt-get install telegraf
- Edit Telegraf’s main configuration file
nano /etc/telegraf/telegraf.conf
- Modify the database connection information. The server IP is the public IP of the InfluxDB machine. Note that the account and password here are not those of the database but the HTTP authentication account password of InfluxDB
[[outputs.influxdb]]
  urls = ["http://server_ip:8086"]
  database = "telegraf"
  username = "admin"
  password = "your_password"
-
Note that modifying hostname is used to distinguish different machines
-
After configuration, start and restart Telegraf and set auto-start at boot
systemctl restart telegraf
systemctl enable telegraf
4. Configure Grafana & InfluxDB
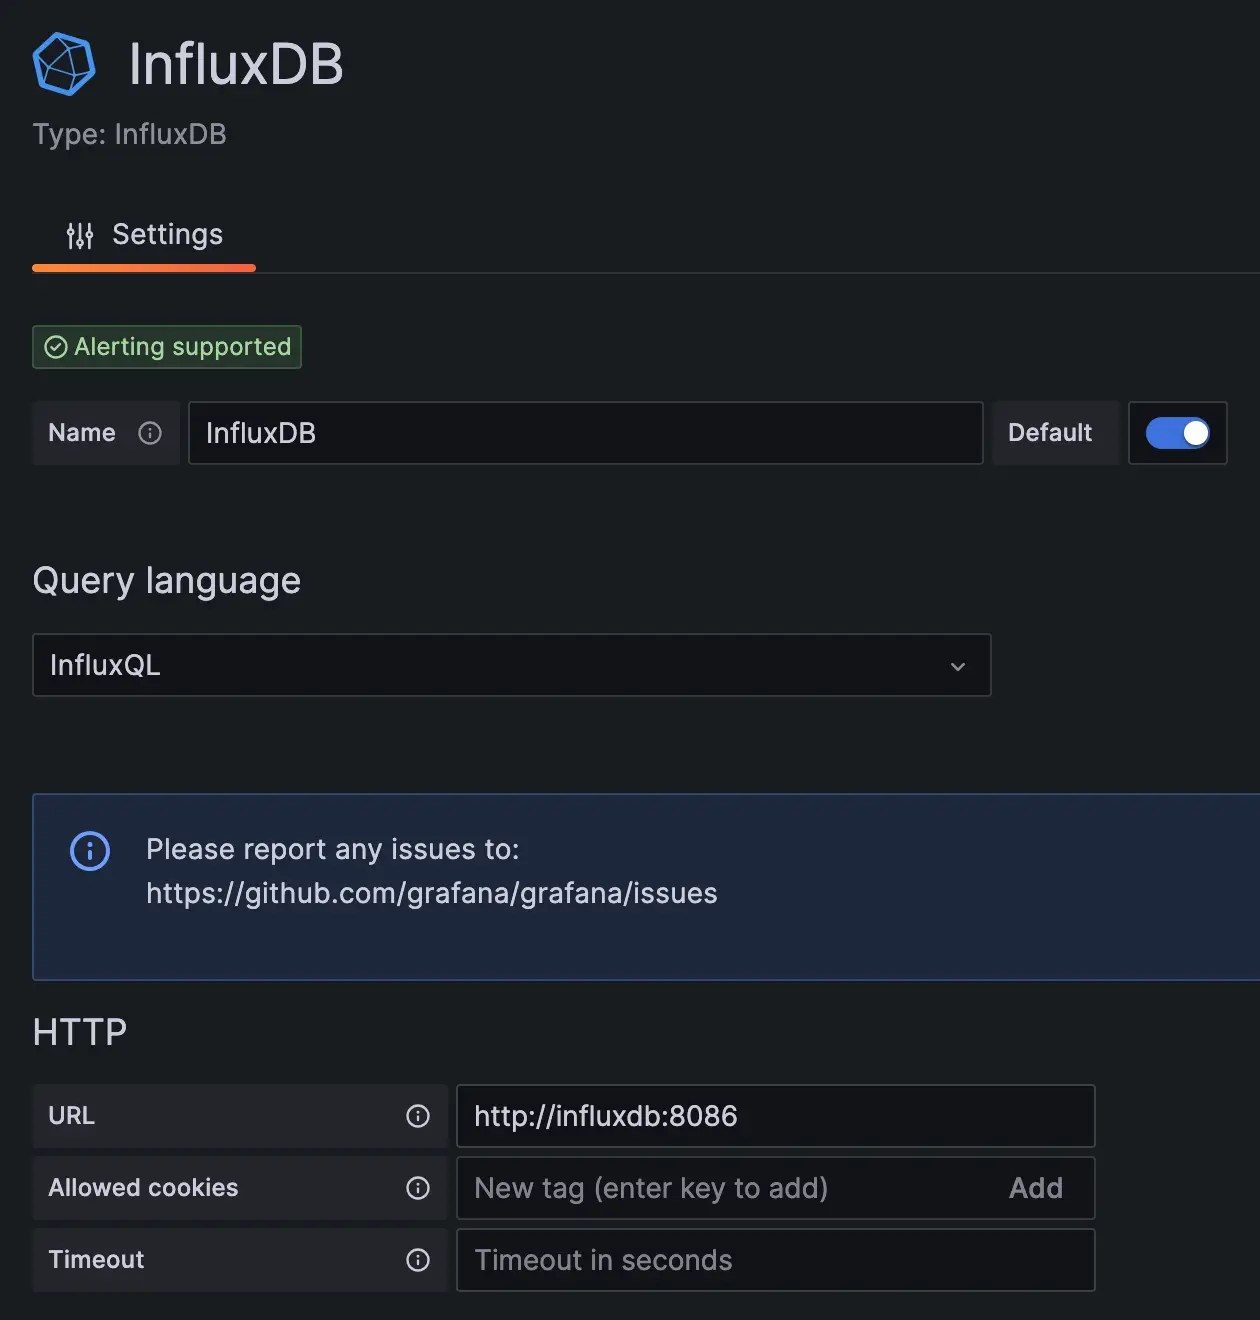
- Visit your site to open Grafana. The default administrator account and password are both admin. After logging in, add the data source:
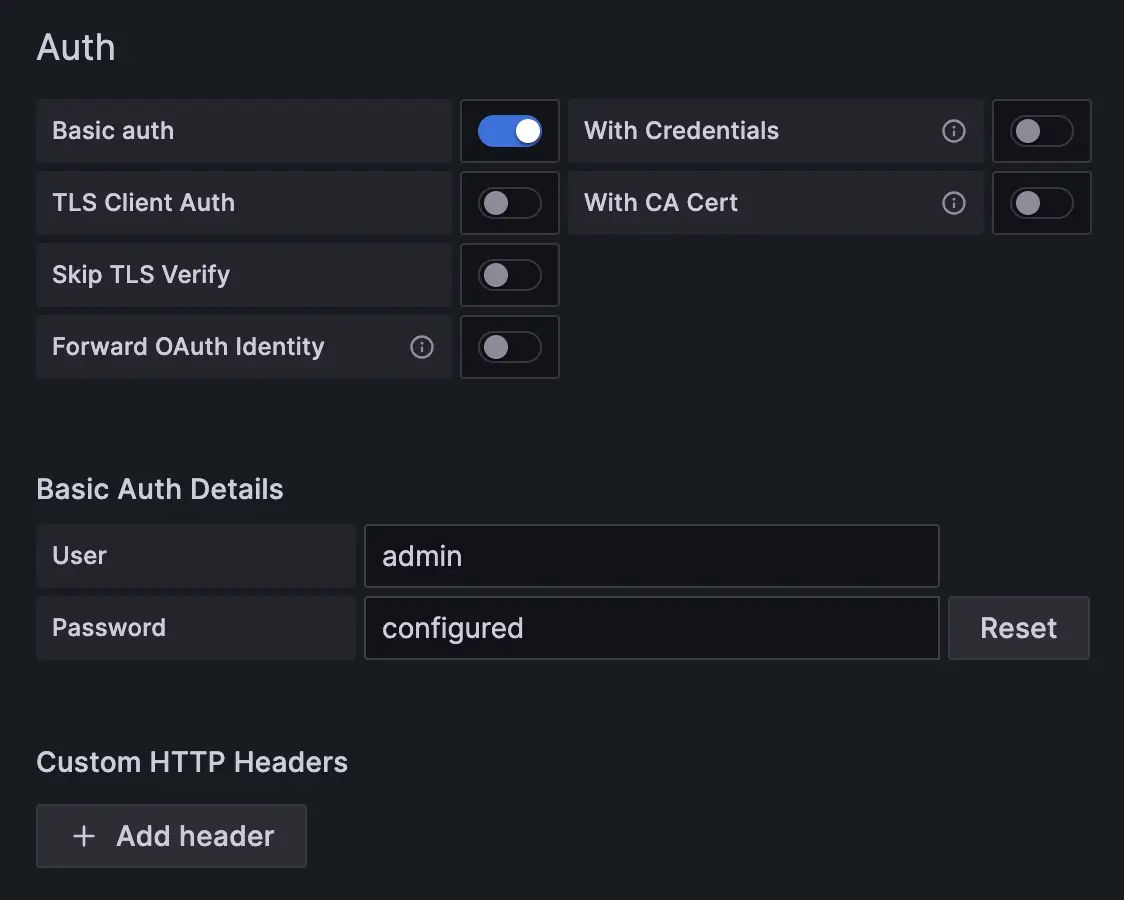
- Check BasicAuth and fill in the account password for INFLUXDB's HTTP authentication
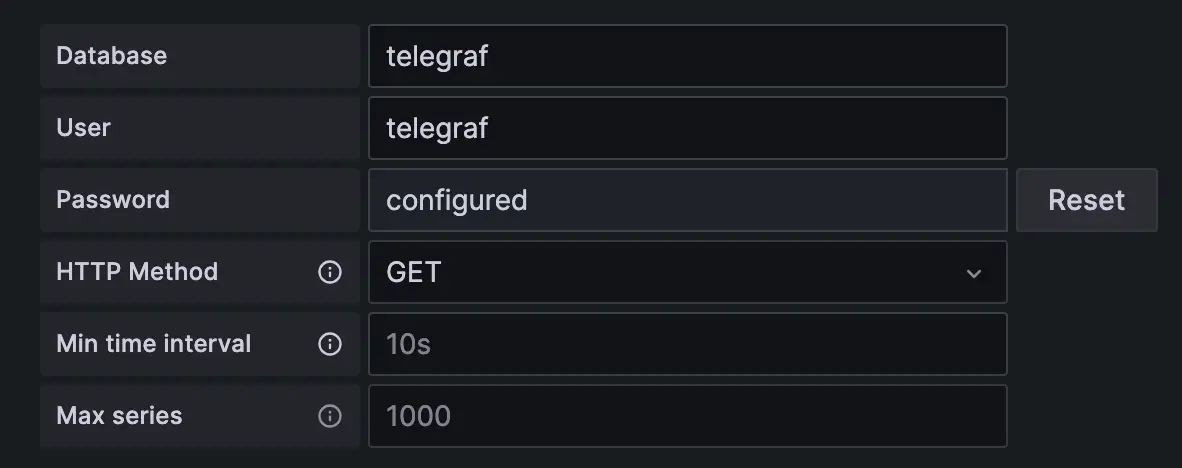
- Fill in database information
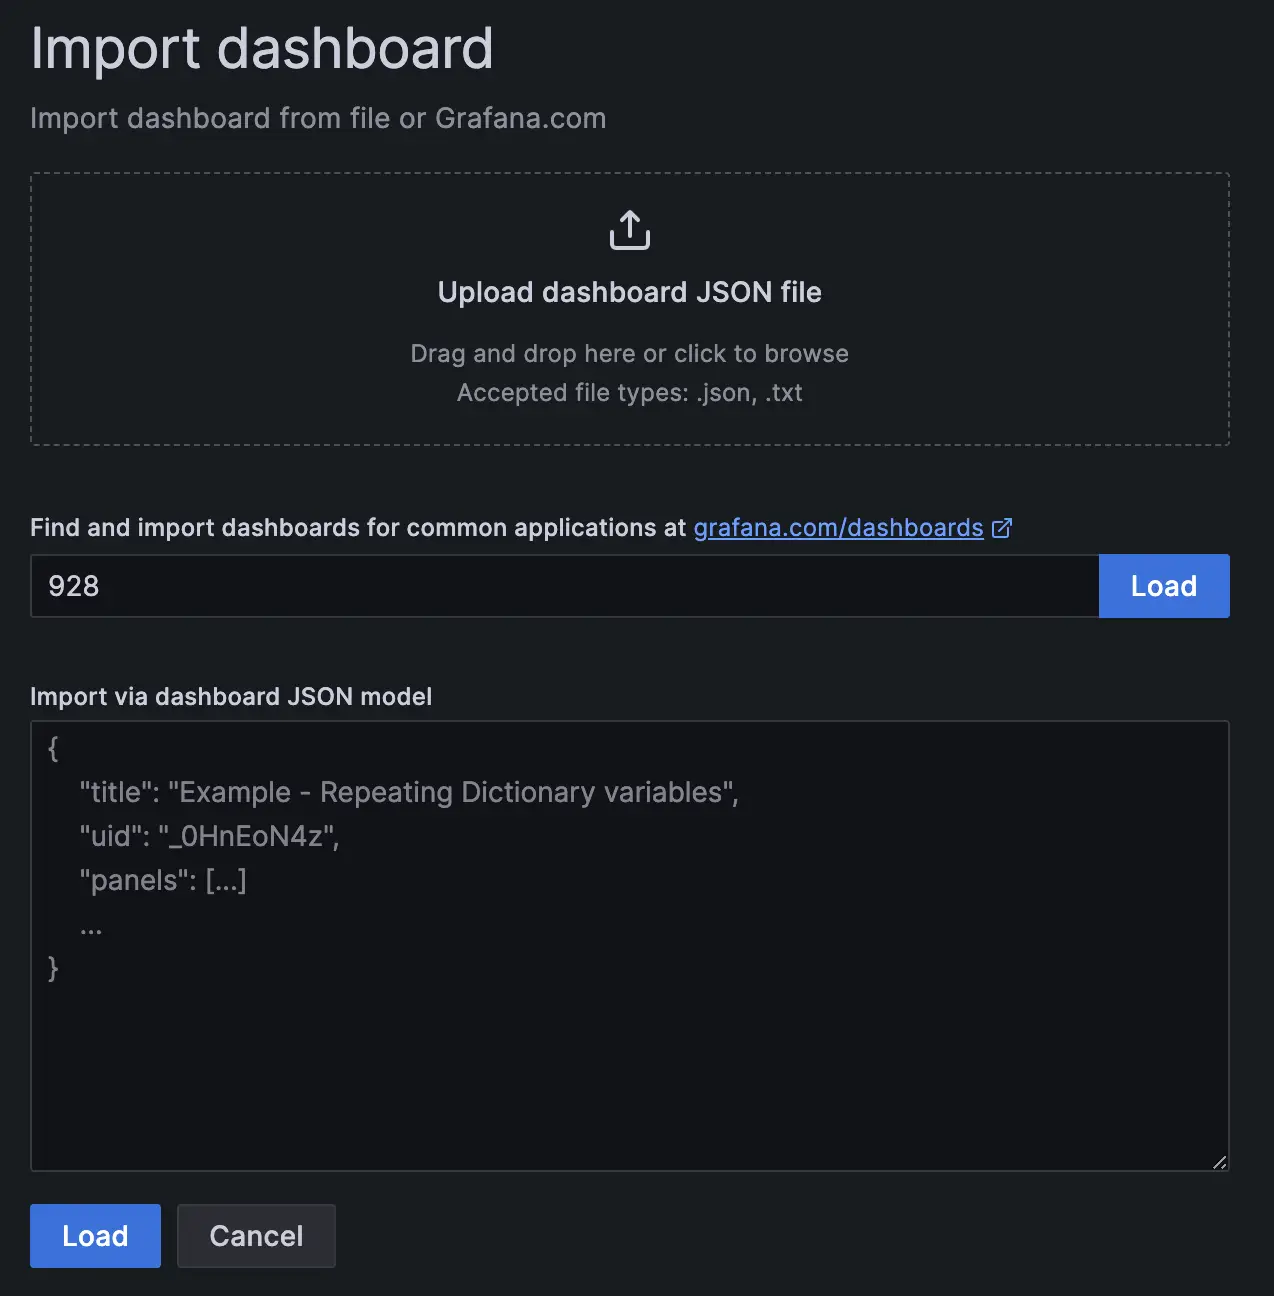
- Add a dashboard. You can import some default dashboards by its ID
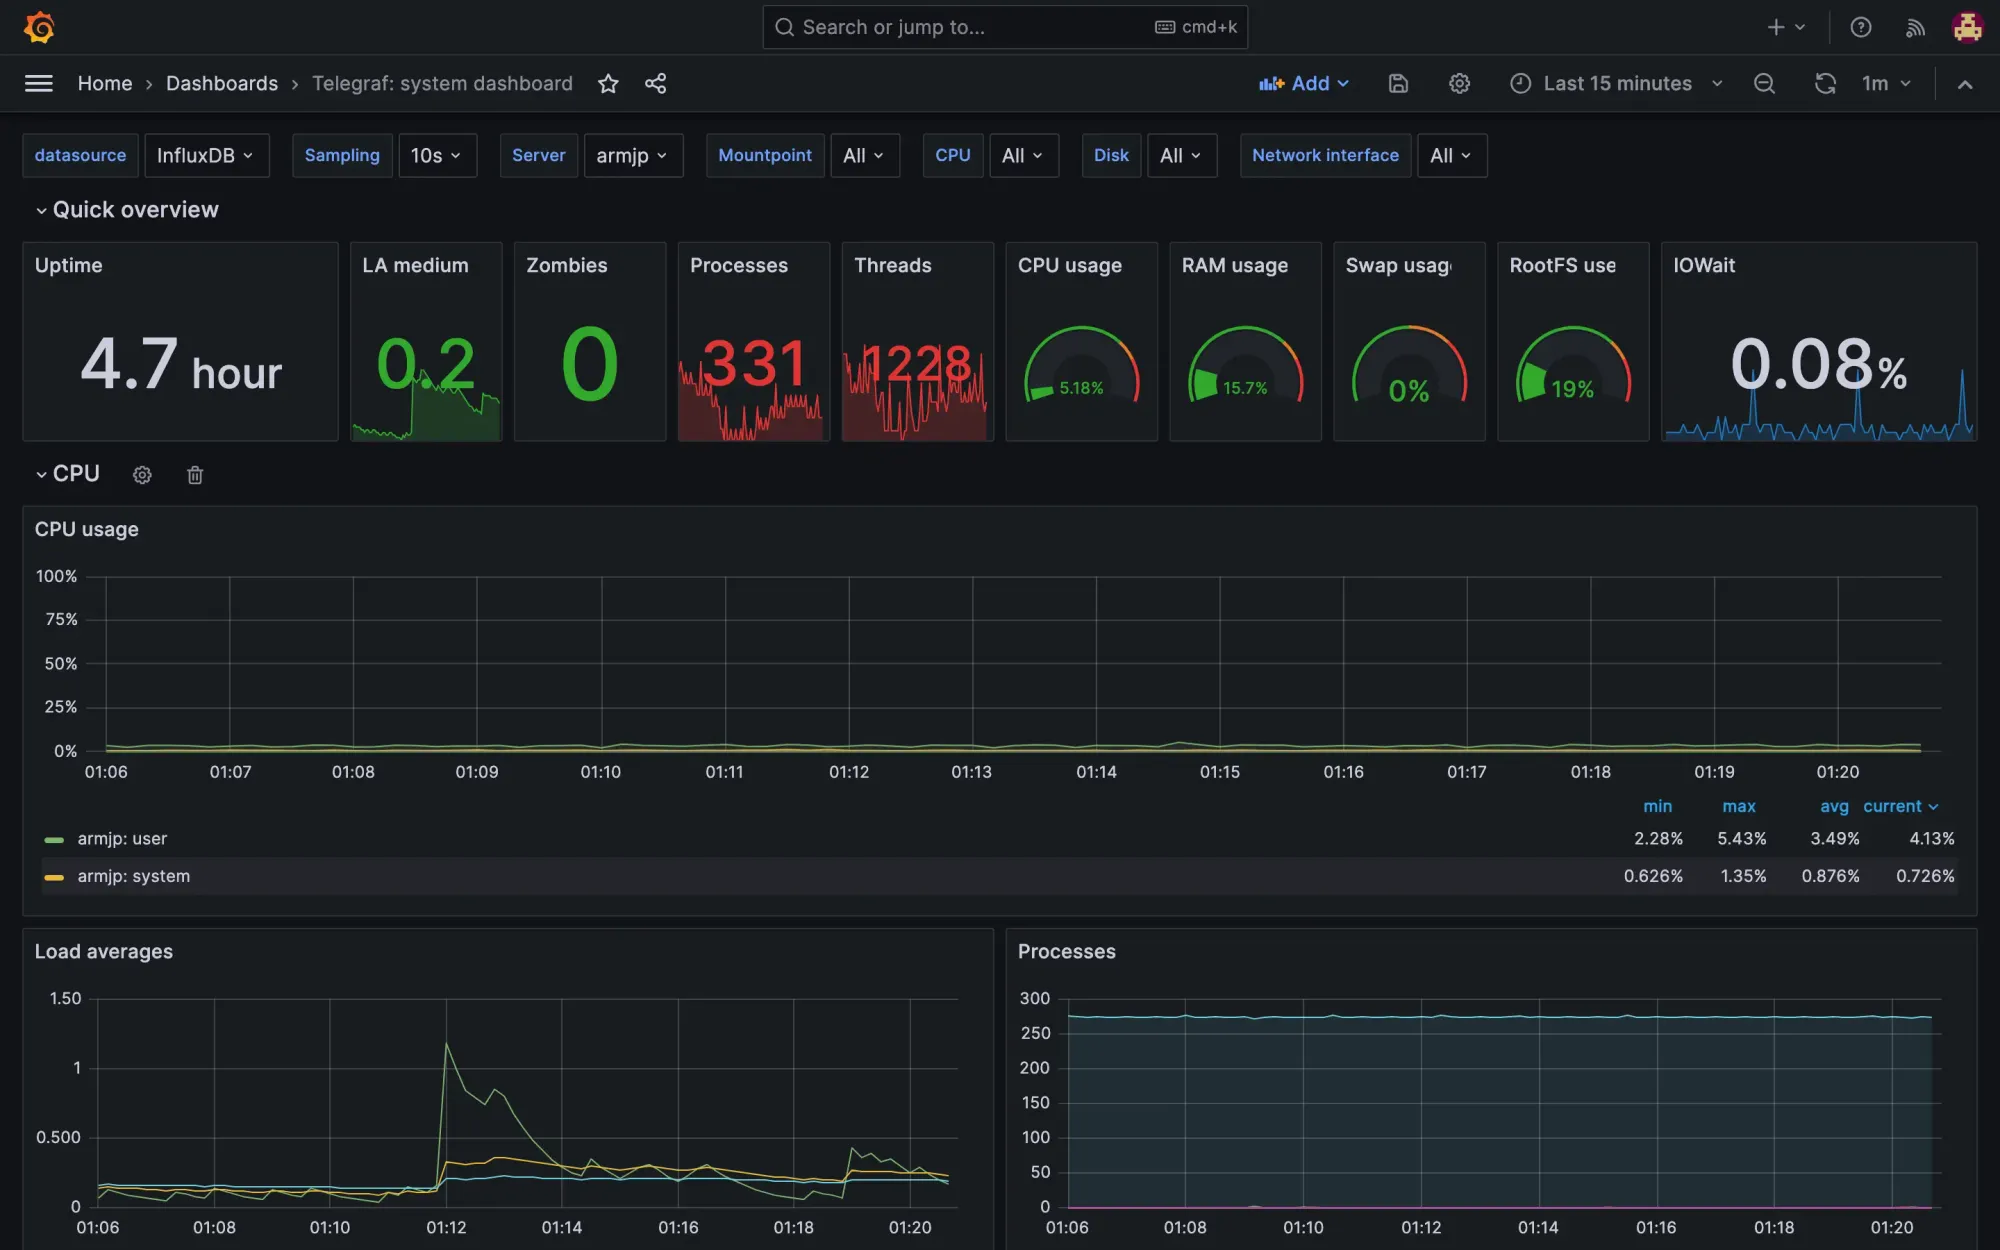
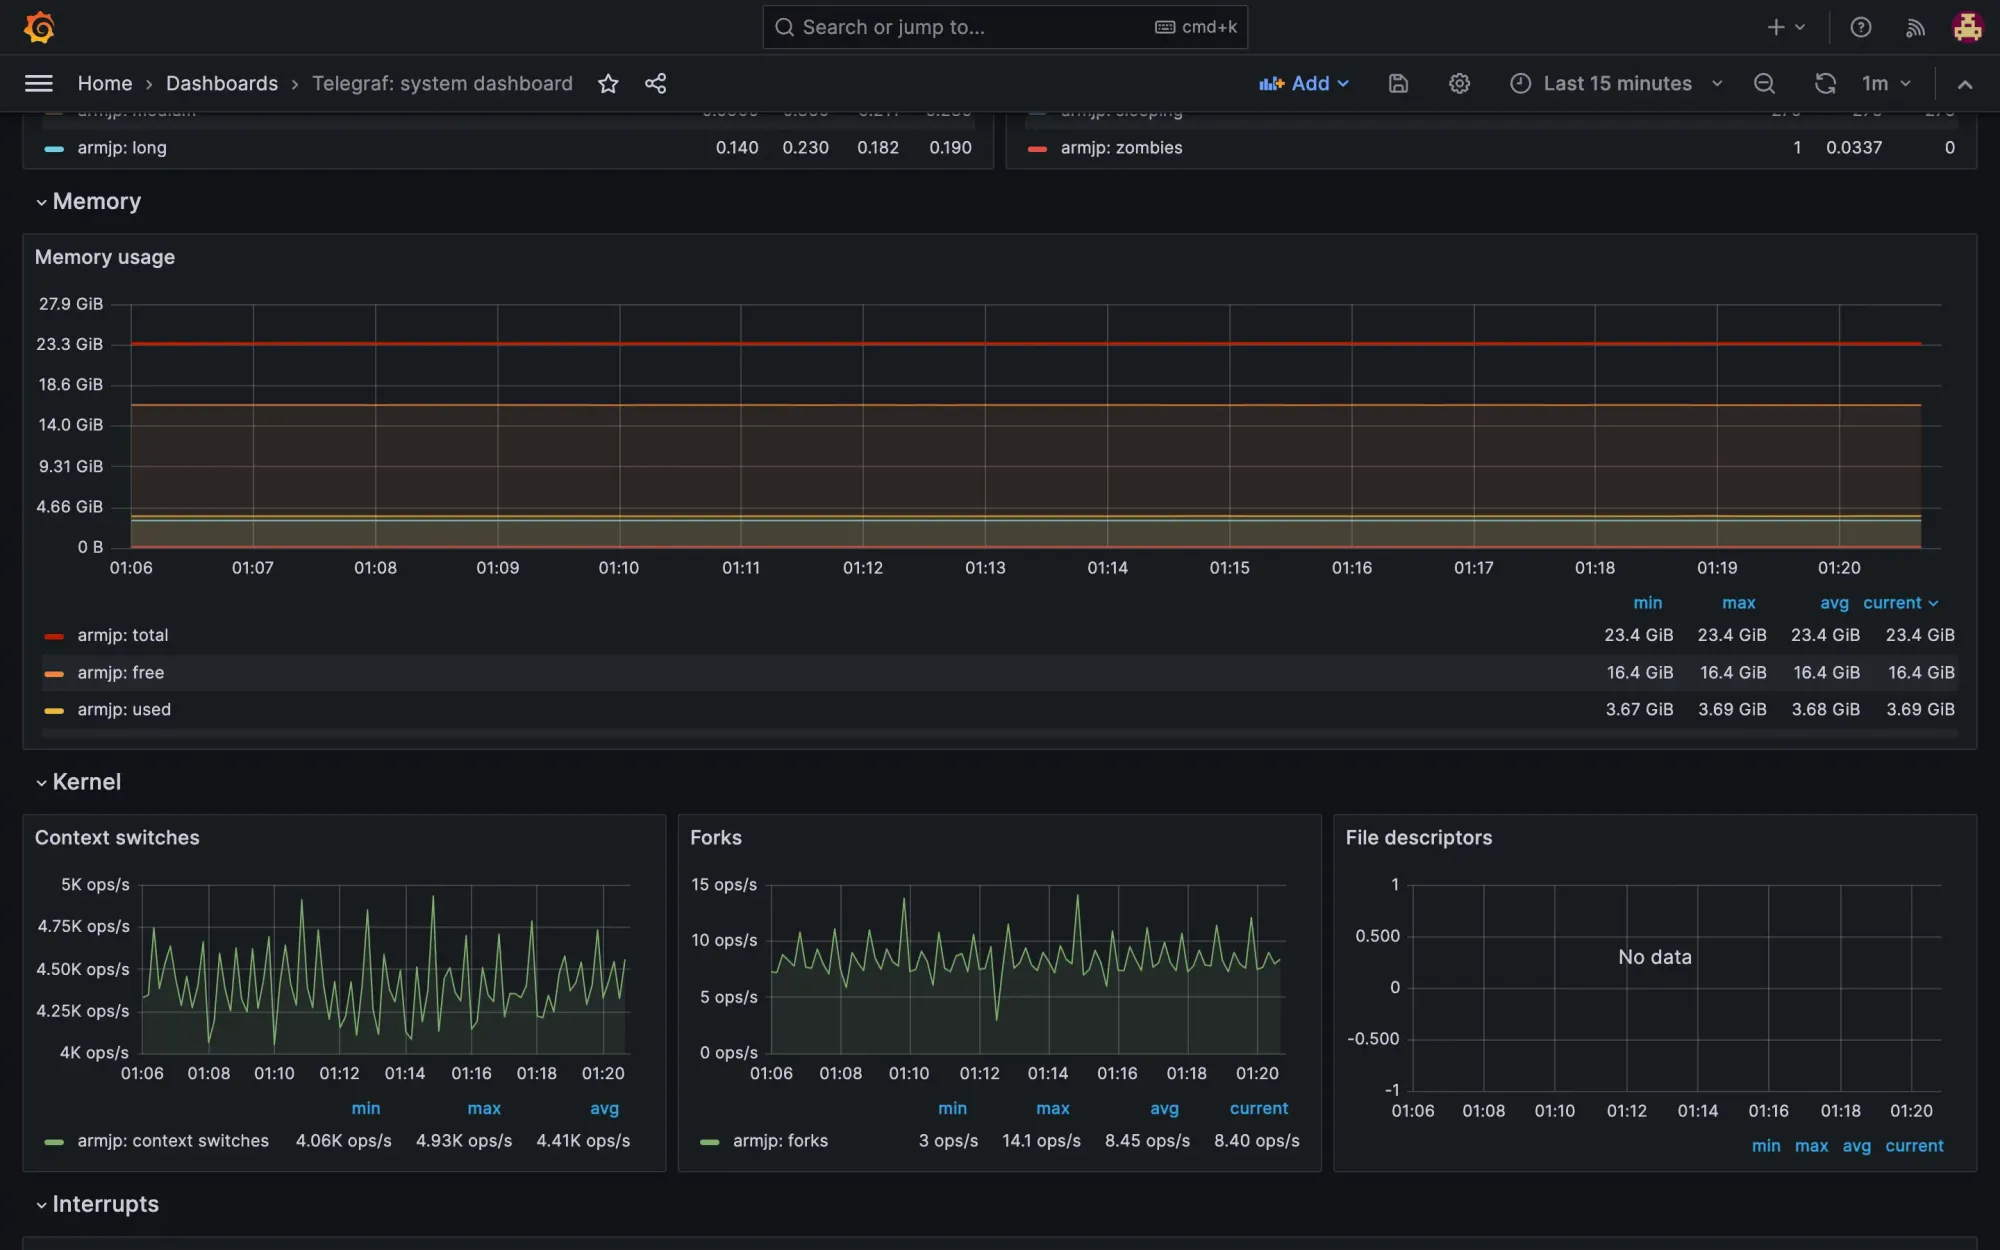
5. DEMO
Copyright statement: Unless otherwise stated, all articles on this blog adopt the CC BY-NC-SA 4.0 license agreement. For non-commercial reprints and citations, please indicate the author: Henry, and original article URL. For commercial reprints, please contact the author for authorization.